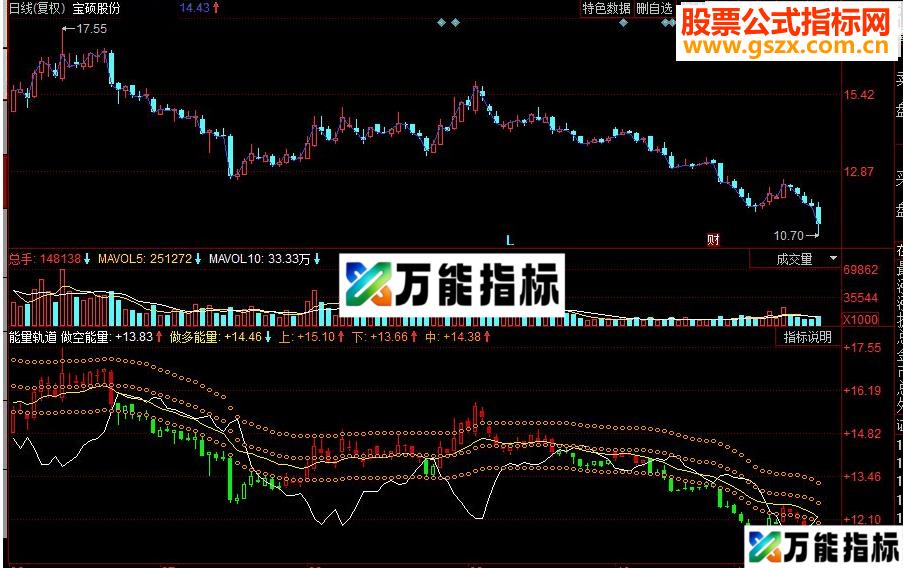

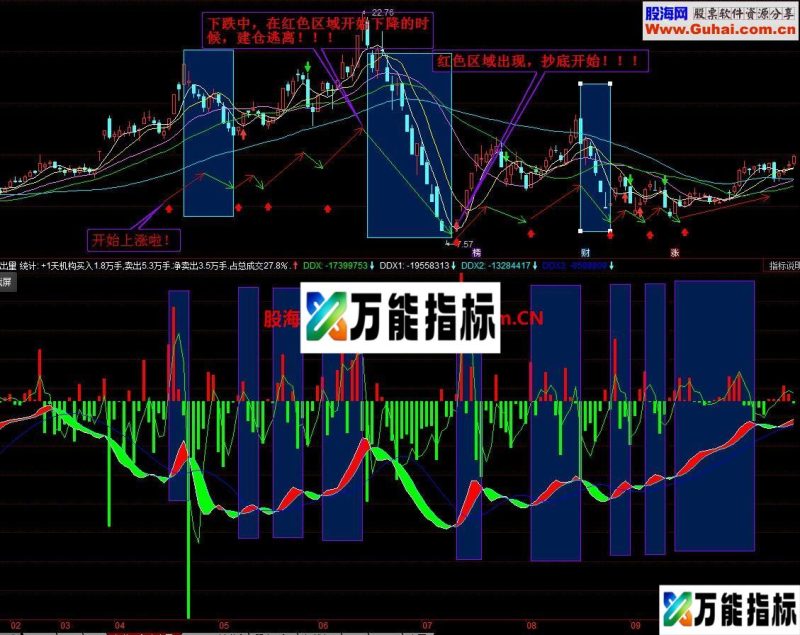
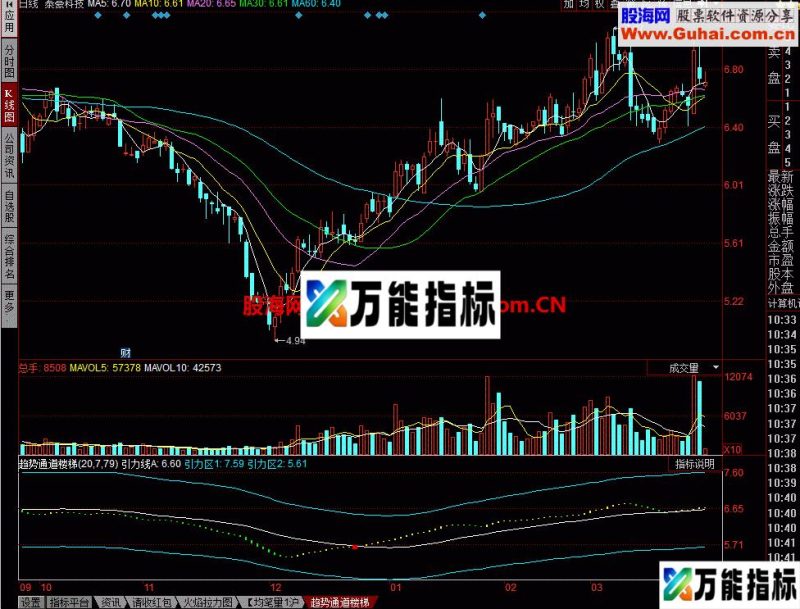
首先要注意整个红色趋势是否开始由下降通道转走平,然后在看副图的K线为红色的,可以考虑分仓买入一些。
r 使用时请结合其他技术指标、成交量、大盘走势等多因素进行综合判断。
r
天:=MAX(O,C);
r地:=MIN(O,C);
r均价:=(H+L+O+C)/4;
r B:=(2*EMA(LLV(均价,7),10)-均价);
r做空能量:(3*B-2*SMA(B,10,10)),colorwhite;
r做多能量:EMA(((SLOPE(CLOSE,3)*3)+CLOSE),20),coloryellow,PRECIS2;
r CC:=ABS((2*CLOSE+HIGH+LOW)/4-MA(CLOSE,20))/MA(CLOSE,20);
r DD:=DMA(CLOSE,CC);
r上:(1.05)*DD,CIRCLEDOT,COLOR0099FF;
r下:(0.95)*DD,CIRCLEDOT,COLOR0099FF;
r中:(上+下)/2,CIRCLEDOT,COLOR0099FF;
r STICKLINE(天>=做空能量 AND C>=O,O,C,7.5,1 ),colorred;
r STICKLINE(天>=做空能量 AND O>C,O,C,7.5,0 ),colorred;
r STICKLINE(天>=做空能量 AND C>=O,C,H,0.5,0),colorred;
r STICKLINE(天>=做空能量 AND C>=O,L,O,0.5,0),colorred;
r STICKLINE(天>=做空能量 AND O>C,L,C,0.5,0),colorred;
r STICKLINE(天>=做空能量 AND O>C,O,H,0.5,0),colorred;
r STICKLINE(地<做空能量 AND C>=O,O,C,7.5,1 ),colorgreen;
r STICKLINE(地<做空能量 AND O>C,O,C,7.5,0),colorgreen;
r STICKLINE(地<做空能量 AND C<O,O,H,0.5,0),colorgreen;
r STICKLINE(地<做空能量 AND C<O,C,L,0.5,0),colorgreen;
r STICKLINE(地<做空能量 AND C>=O,O,L,0.5,0),colorgreen;
r STICKLINE(地<做空能量 AND C>=O,C,H,0.5,0),colorgreen;
r


暂无评论内容